How to Capture and Analyze Site Launches with Web Launch Recorder and Its Alternatives
Advertisement
When launching a website or app, a lot happens in just a few seconds. Pages load, trackers run, and dozens of events fire up behind the scenes. Sometimes, things don't go as expected, and if you can't see what happened at launch, it's hard to fix what went wrong. That's where tools like Web Launch Recorder come in. They capture everything that unfolds right at the moment your site opens, letting you replay those sessions and catch hidden issues early.
If you’re curious whether it’s the right fit or just want to explore your options, here’s a closer look at how Web Launch Recorder works and a few solid alternatives worth checking out.
What Is Web Launch Recorder and How Does It Work?
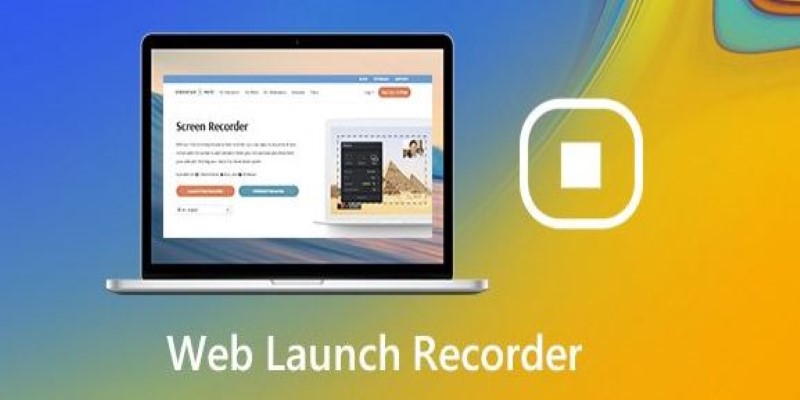
Web Launch Recorder is designed to monitor and capture the entire launch behavior of your website or application. Instead of relying on standard error reports or logs, it records the experience, helping you see what your users see the moment they access your site.
It works like this: once installed, it starts recording the browser environment right from page load. This includes HTTP requests, console logs, DOM changes, and any key events. If something breaks during load — maybe a script fails, or a tracker misfires — you can watch it play out just as it happened.
You’re not just reading logs. You’re seeing a replay of the actual event, which gives you far more context and accuracy when you're debugging or analyzing performance.
Where It Shines

One of the main strengths of Web Launch Recorder is that it’s laser-focused. It's not trying to be a full session replay tool like Hotjar or a crash analytics tool like Sentry. It's built for that precise launch window, making it easy to find issues that appear only during or immediately after a page load.
Some of its better features include:
Launch-specific recording: It narrows in on that short launch period, which keeps the data relevant and focused.
Developer-friendly interface: You get a timeline view that lays out what happened and when — no digging through logs line by line.
Environment snapshots: You can check the browser, OS, screen size, and even network conditions during the session.
What Could Be Better
Web Launch Recorder doesn't try to do everything, and for some users, that's a downside. It won't give you a full picture of a user's behavior beyond launch. If your issues happen later in a session, you'll need another tool.
There’s also the matter of integration. It can take a bit of setup, especially if you’re not already familiar with monitoring tools. The documentation is helpful, but it still leans more toward developers. Teams without dedicated dev resources might find it slower to implement.
3 Best Alternatives to Web Launch Recorder
If you're looking for something more flexible, easier to set up, or better suited for ongoing monitoring, here are three alternatives that work well, depending on your goals.
1. FullStory – Session Replays with More Context
FullStory isn’t just about the launch — it captures everything users do on your site. That includes scrolls, clicks, page transitions, and more. If you're trying to understand how users actually interact with your site, this tool gives you the full picture.
Where it stands out:
Automatic data capture: You don’t have to tag specific events. It captures just about everything out of the box.
Filters and search: You can narrow down sessions by device, page, or error type.
Heatmaps: Besides replays, you get visual insights into where users spend time or drop off.
It's a good fit if your problems go beyond just launch issues, like users getting stuck on forms, navigation that's not intuitive, or slow-loading elements deeper into your app.
2. LogRocket – A Blend of Recording and Logging

LogRocket combines session replay with detailed logs and performance data. It’s similar to Web Launch Recorder in its developer-first approach, but it gives you visibility throughout the user session, not just at launch.
Standout features:
Console and network tracking: Like Web Launch Recorder, it shows what’s going on under the hood.
Redux state tracking (for React apps): You can see the exact state of your app at each step.
Issue grouping: It groups similar problems, helping you identify patterns faster.
What makes it appealing is that it works well for both developers and product teams. You get technical details and behavioral insights in one place. And if your site runs on modern frameworks like React or Vue, it fits in nicely with your stack.
3. Raygun – Focused on Performance and Crashes
Raygun leans more into performance monitoring and error tracking than session replay. If your main goal is to catch crashes, slowdowns, or failed requests right at launch, this one hits the mark.
What it offers:
Real user monitoring (RUM): You get data from actual users, not just synthetic tests.
Detailed error reports: They tell you exactly where and why something failed.
APM and crash reporting: Works well across both frontend and backend environments.
This makes it a smart choice if you’re troubleshooting performance bottlenecks, especially for more complex web apps. You won’t get the kind of visual replays you’d get from other tools, but the diagnostics are thorough and well-organized.
Final Thoughts
Web Launch Recorder is a focused, useful tool for capturing what happens right as your site or app opens. If launch issues are giving you trouble, this tool gives you a precise way to see what’s going on. But it has its limits — it won’t show you the full user session or behavior trends over time. If you need a broader view, FullStory and LogRocket give you that with full session replays and rich context. Raygun, on the other hand, sharpens its focus on errors and performance.
On this page
What Is Web Launch Recorder and How Does It Work? Where It Shines What Could Be Better 3 Best Alternatives to Web Launch Recorder 1. FullStory – Session Replays with More Context 2. LogRocket – A Blend of Recording and Logging 3. Raygun – Focused on Performance and Crashes Final ThoughtsAdvertisement
Related Articles

Discover 10 Smart TickTick Automation Ideas for Your Daily Workflow

How to Schedule Mailchimp Campaigns Using Google Calendar: A Step-by-Step Guide

Steps to Add Hyperlinks in Gmail

5 Creative GitHub Automation Ideas to Try

Top 10 Slack Automation Ideas to Boost Workflow Efficiency

Everything You Need To Know About Google Docs Pageless View

How to Use JustCall and ChatGPT for Smarter Customer Service?

How to Get Your Webflow Form Responses into Google Sheets — A Quick and Easy Guide

How to Reverse a Clip in Premiere Pro Without a Hitch

10 Reasons Why MailerLite Stands Out in 2025: A Complete Review for Email Marketers

How Can You Collect Customer Feedback and Take Action with Enalyzer?

 novityinfo